How many users who use your application are you retaining? What does it even mean to retain a user? To measure this you will need to measure weekly and/or monthly active users and sign-ups. You will need a tool to measure these. I'll be using Mixpanel in this example.
What Is Retention?#
There are many ways to think about retention. We are going to explore one definition in particular.
Retained users are users who engaged with your application after the initial time period in which they first engaged with your application.
For example, if a user first engages in March and engages again in April they have been retained for one month.
Formula for Retention#
A = Active Users (users who did a Core User Action)
B = Active Sign-Ups (users who signed up AND did a Core User Action)
Retention for the time period = (A - B)
Note: This does not measure your onboarding funnel. People who sign up but never meaningfully engage with your application cannot be retained because they were never really engaged. We will discuss onboarding funnels in a later article.
Core User Actions#
First things first, what are the most important actions for your users to take in order to get value from your application? If you run a chat application it may be "Message Sent" and if its an event tracking app it may be "Event Created". These actions indicate that the user has had a meaningful engagement with your system. Start with only a handful of Core User Actions. You can use other actions for other purposes, but they are not core to delivering value to the user.
In our example we will be using "Event Created" as our Core User Action.
// User created an Event
mixpanel.track("Event Created", { /* ... */ });
Active Users#
An "active user" is someone who has done a Core User Action in your application in a given time period. Ask, "Did this user engage with my application in a meaningful way for this time period?"
Your "weekly active users" (WAU) are the users who had a meaningful engagement for a given week. "Monthly active users" (MAU) are the users who had a meaningful engagement for a given month. And so on.
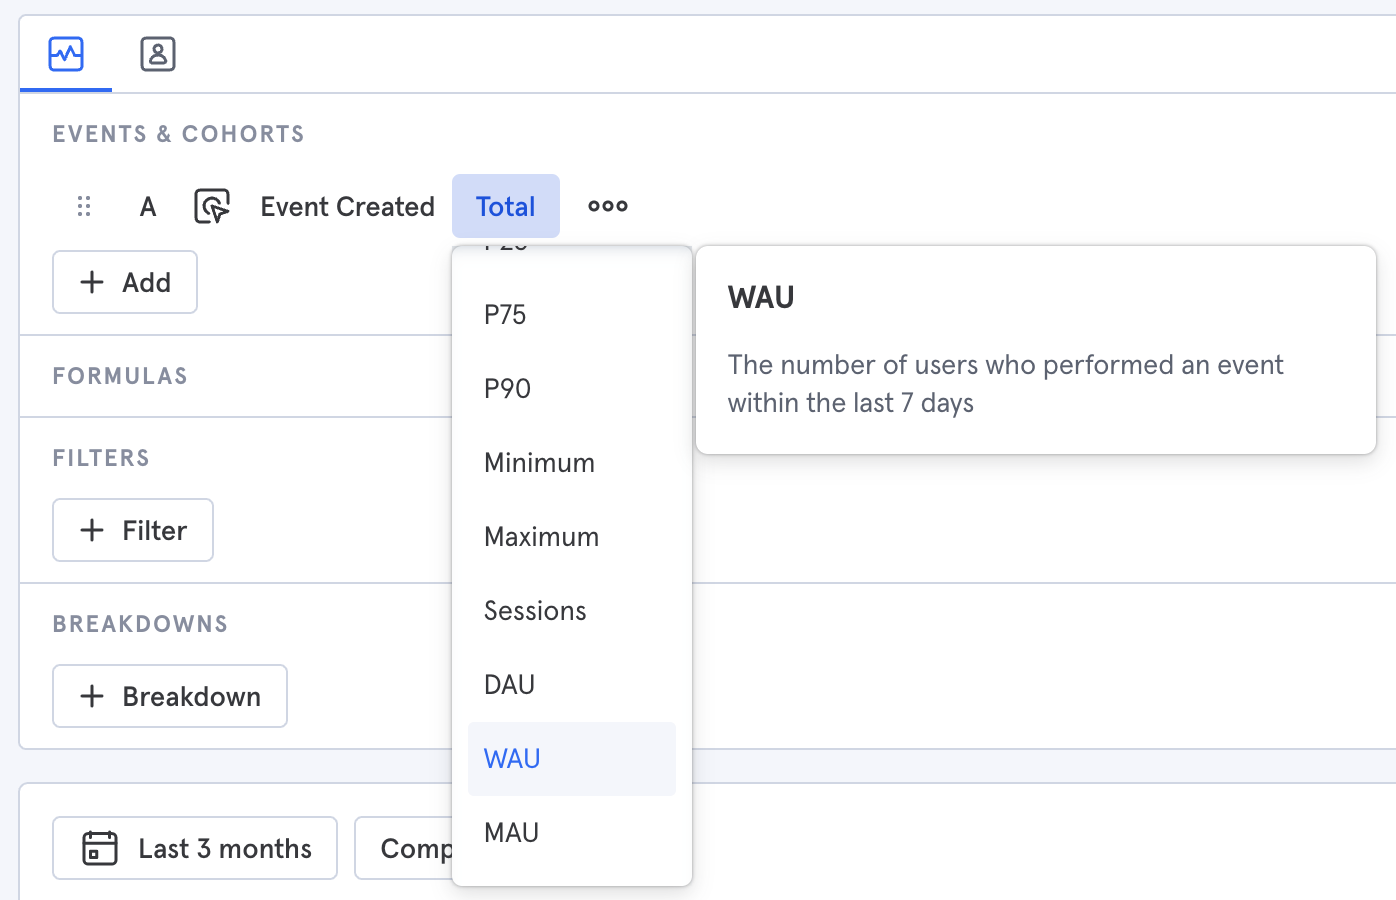
Let's take a look at real WAU statistics in Mixpanel, you can view your active users under Analysis > Insights. Select an event that represents a Core User Action (In my example it is "Event Created"). Then click where it says "total" and from this menu select "WAU".
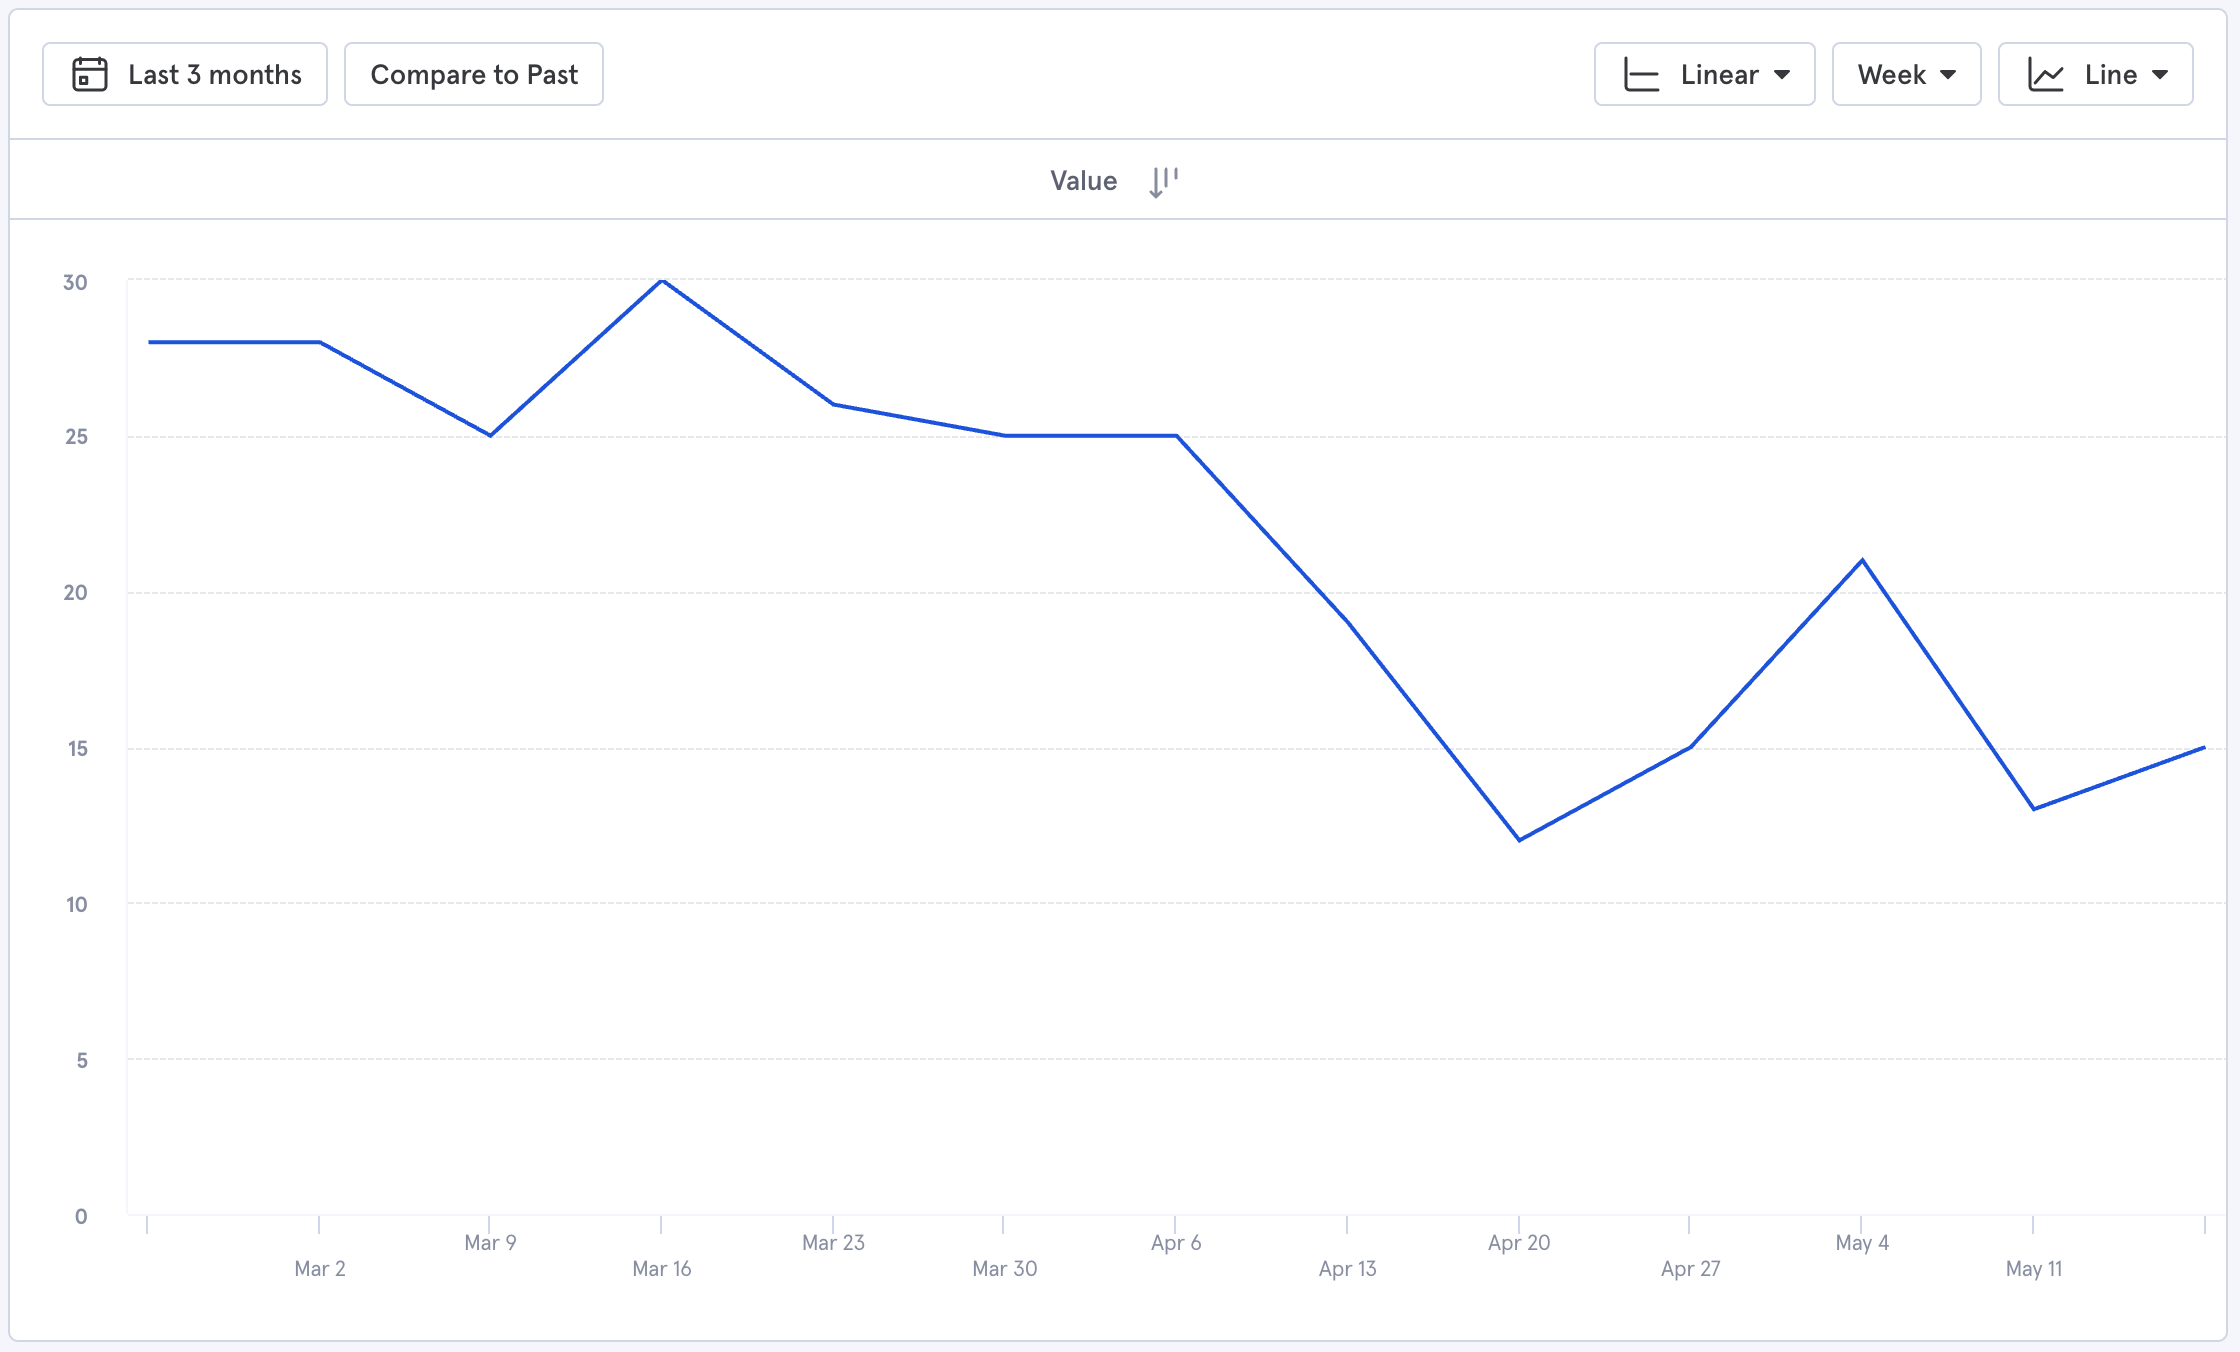
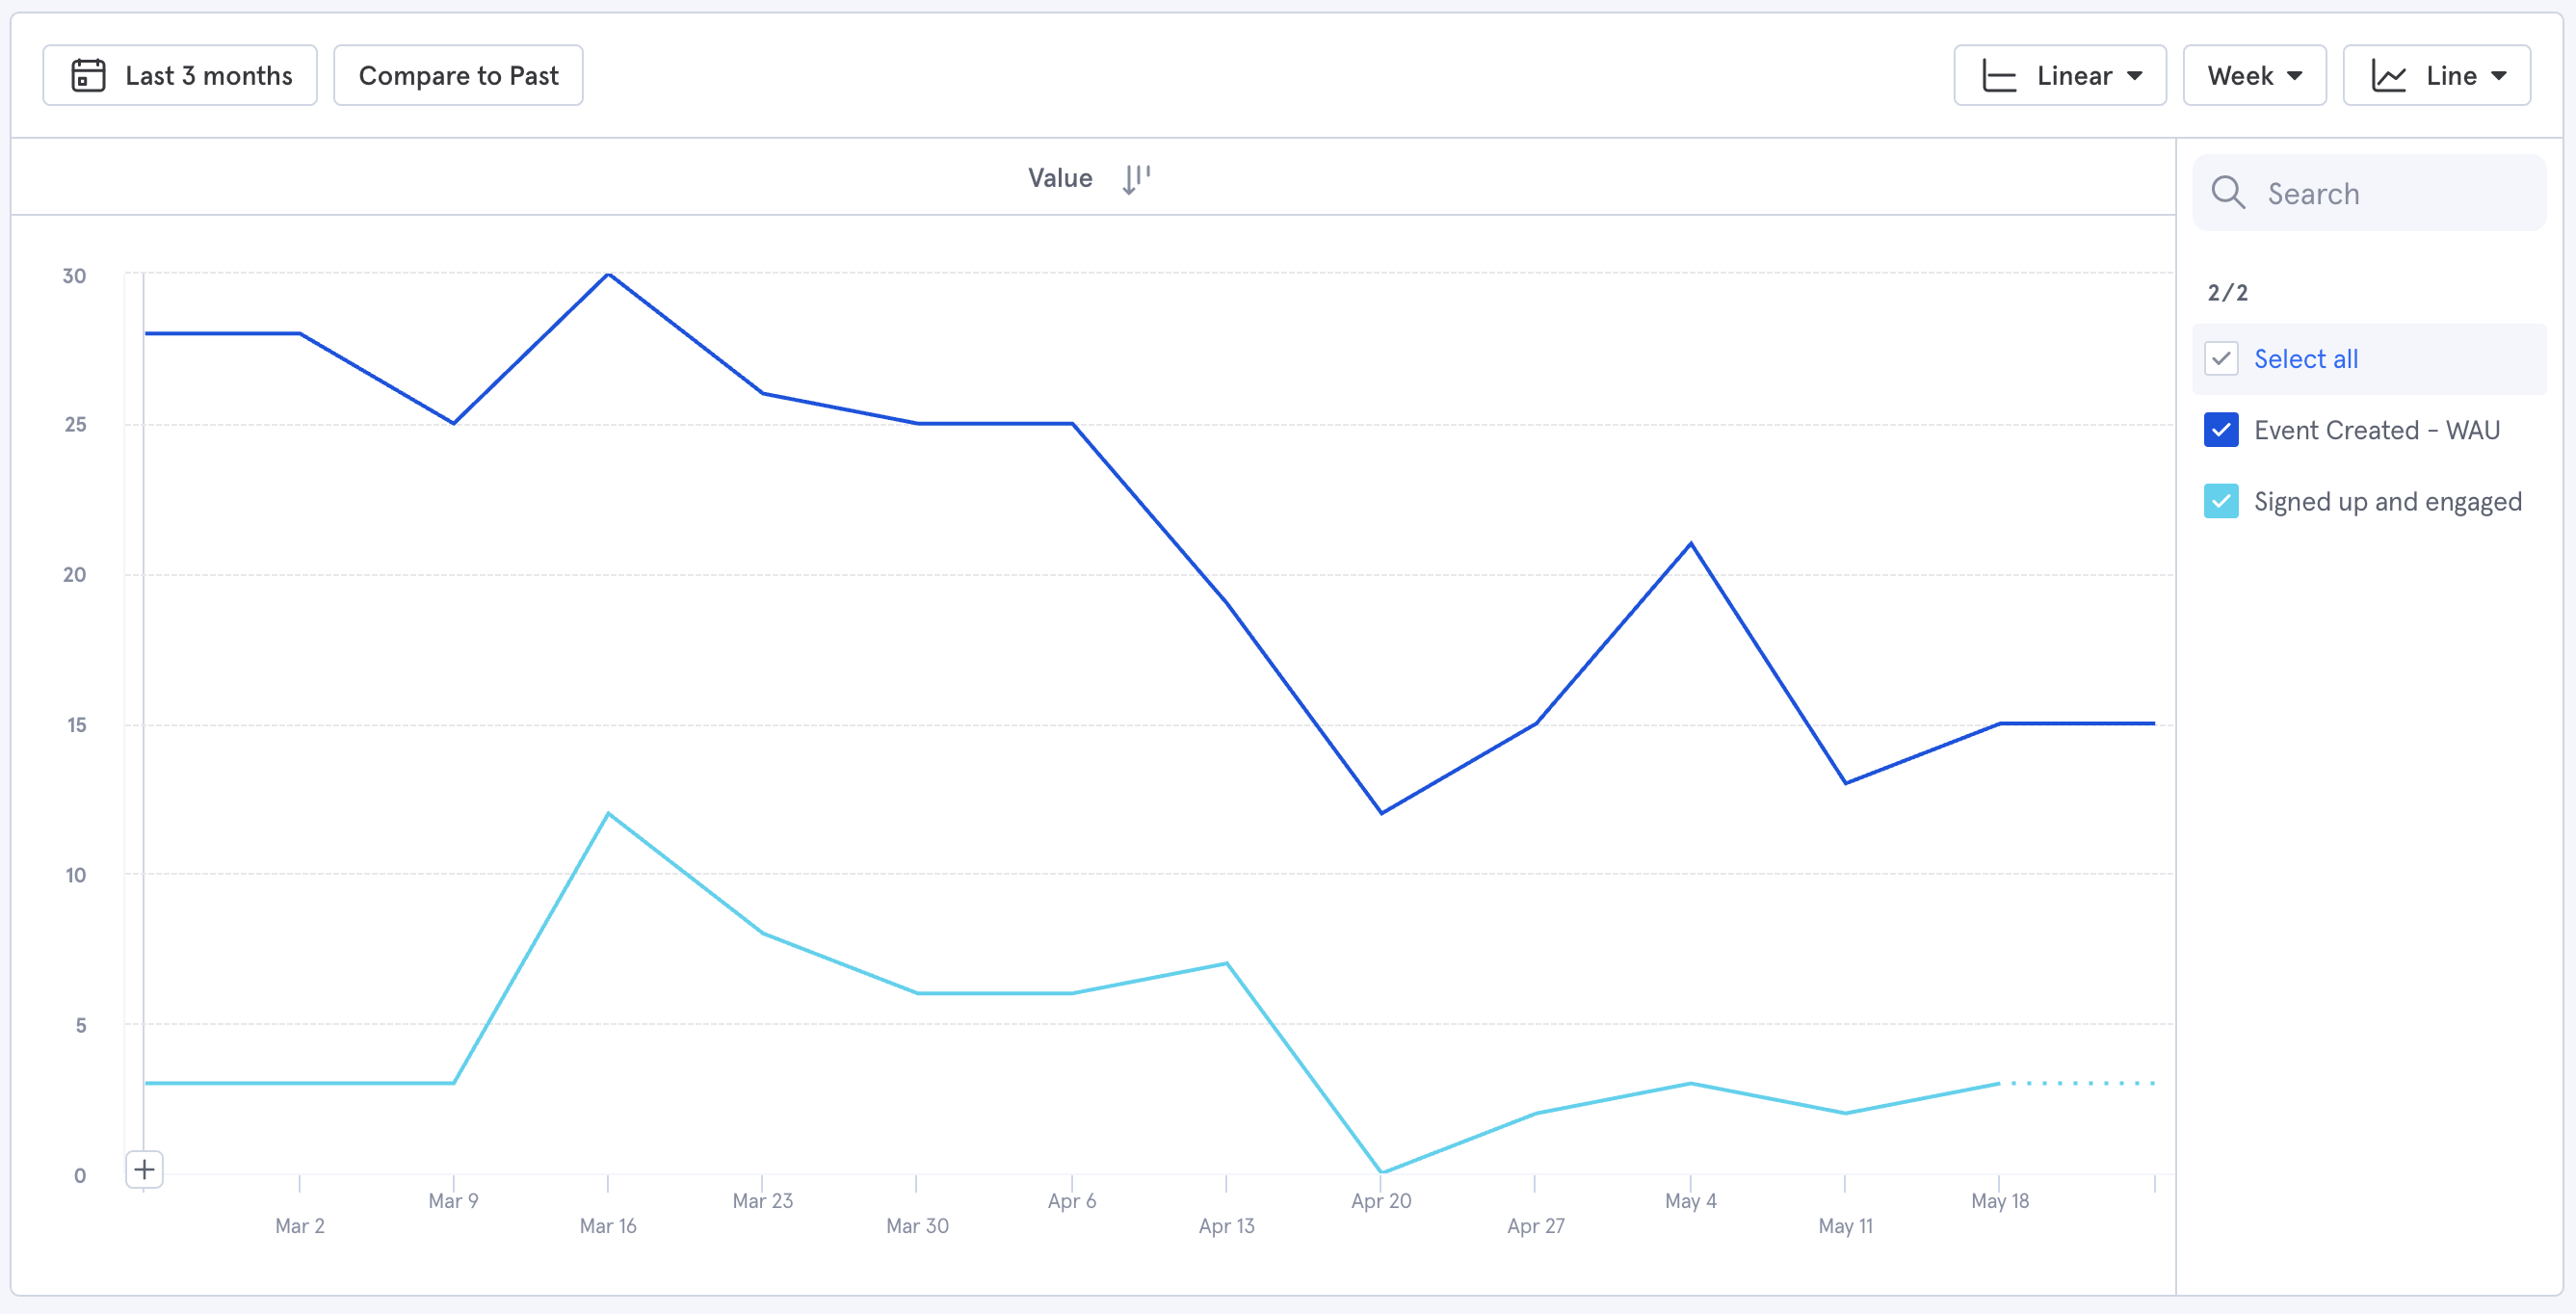
Now we will be able to see our active users on the graph below. These are the users who engaged meaningfully with our application, by week.
Active Sign-Ups#
Now that we have our active users graphed, we need to find the number of users who signed up AND engaged for each time period.
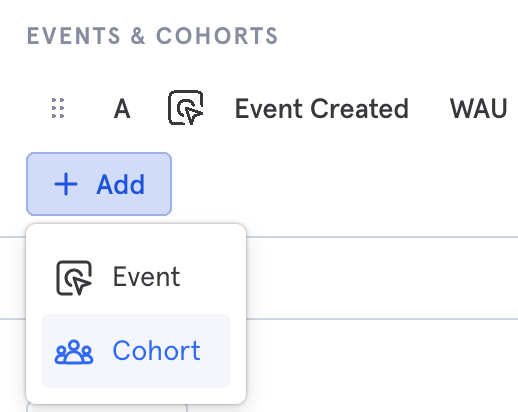
In Mixpanel, add a Cohort to capture people who signed up AND engaged with the application.
Select Add > Cohort.
Select "Create Cohort..." then select your sign-up event.
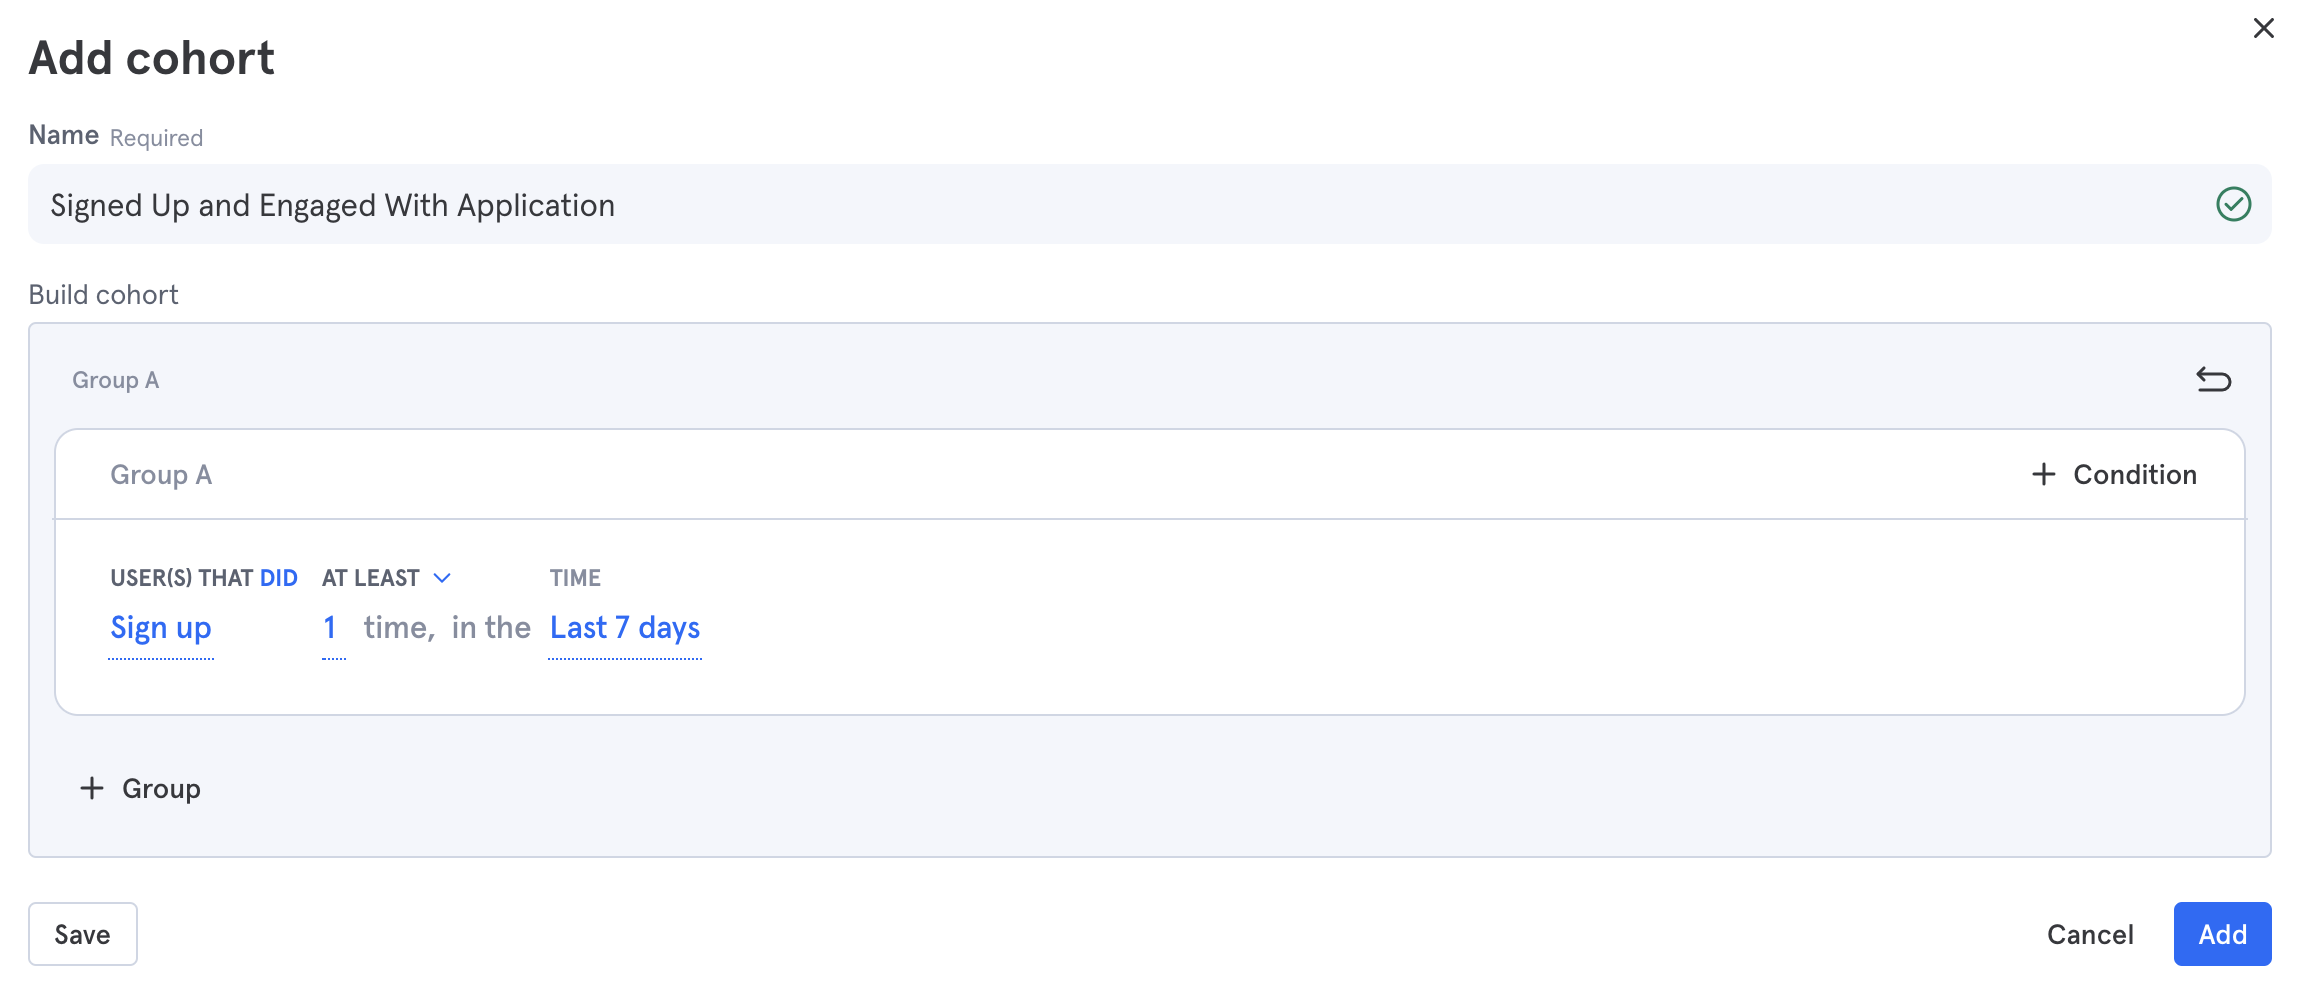
Click "+ Condition" at the top right and select your Core User Action. This tells Mixpanel that you want your "Cohort" to consist of users who triggered "Sign Up" AND "Event Created" in each 7 day period. Click save to view the Active Sign-Ups.
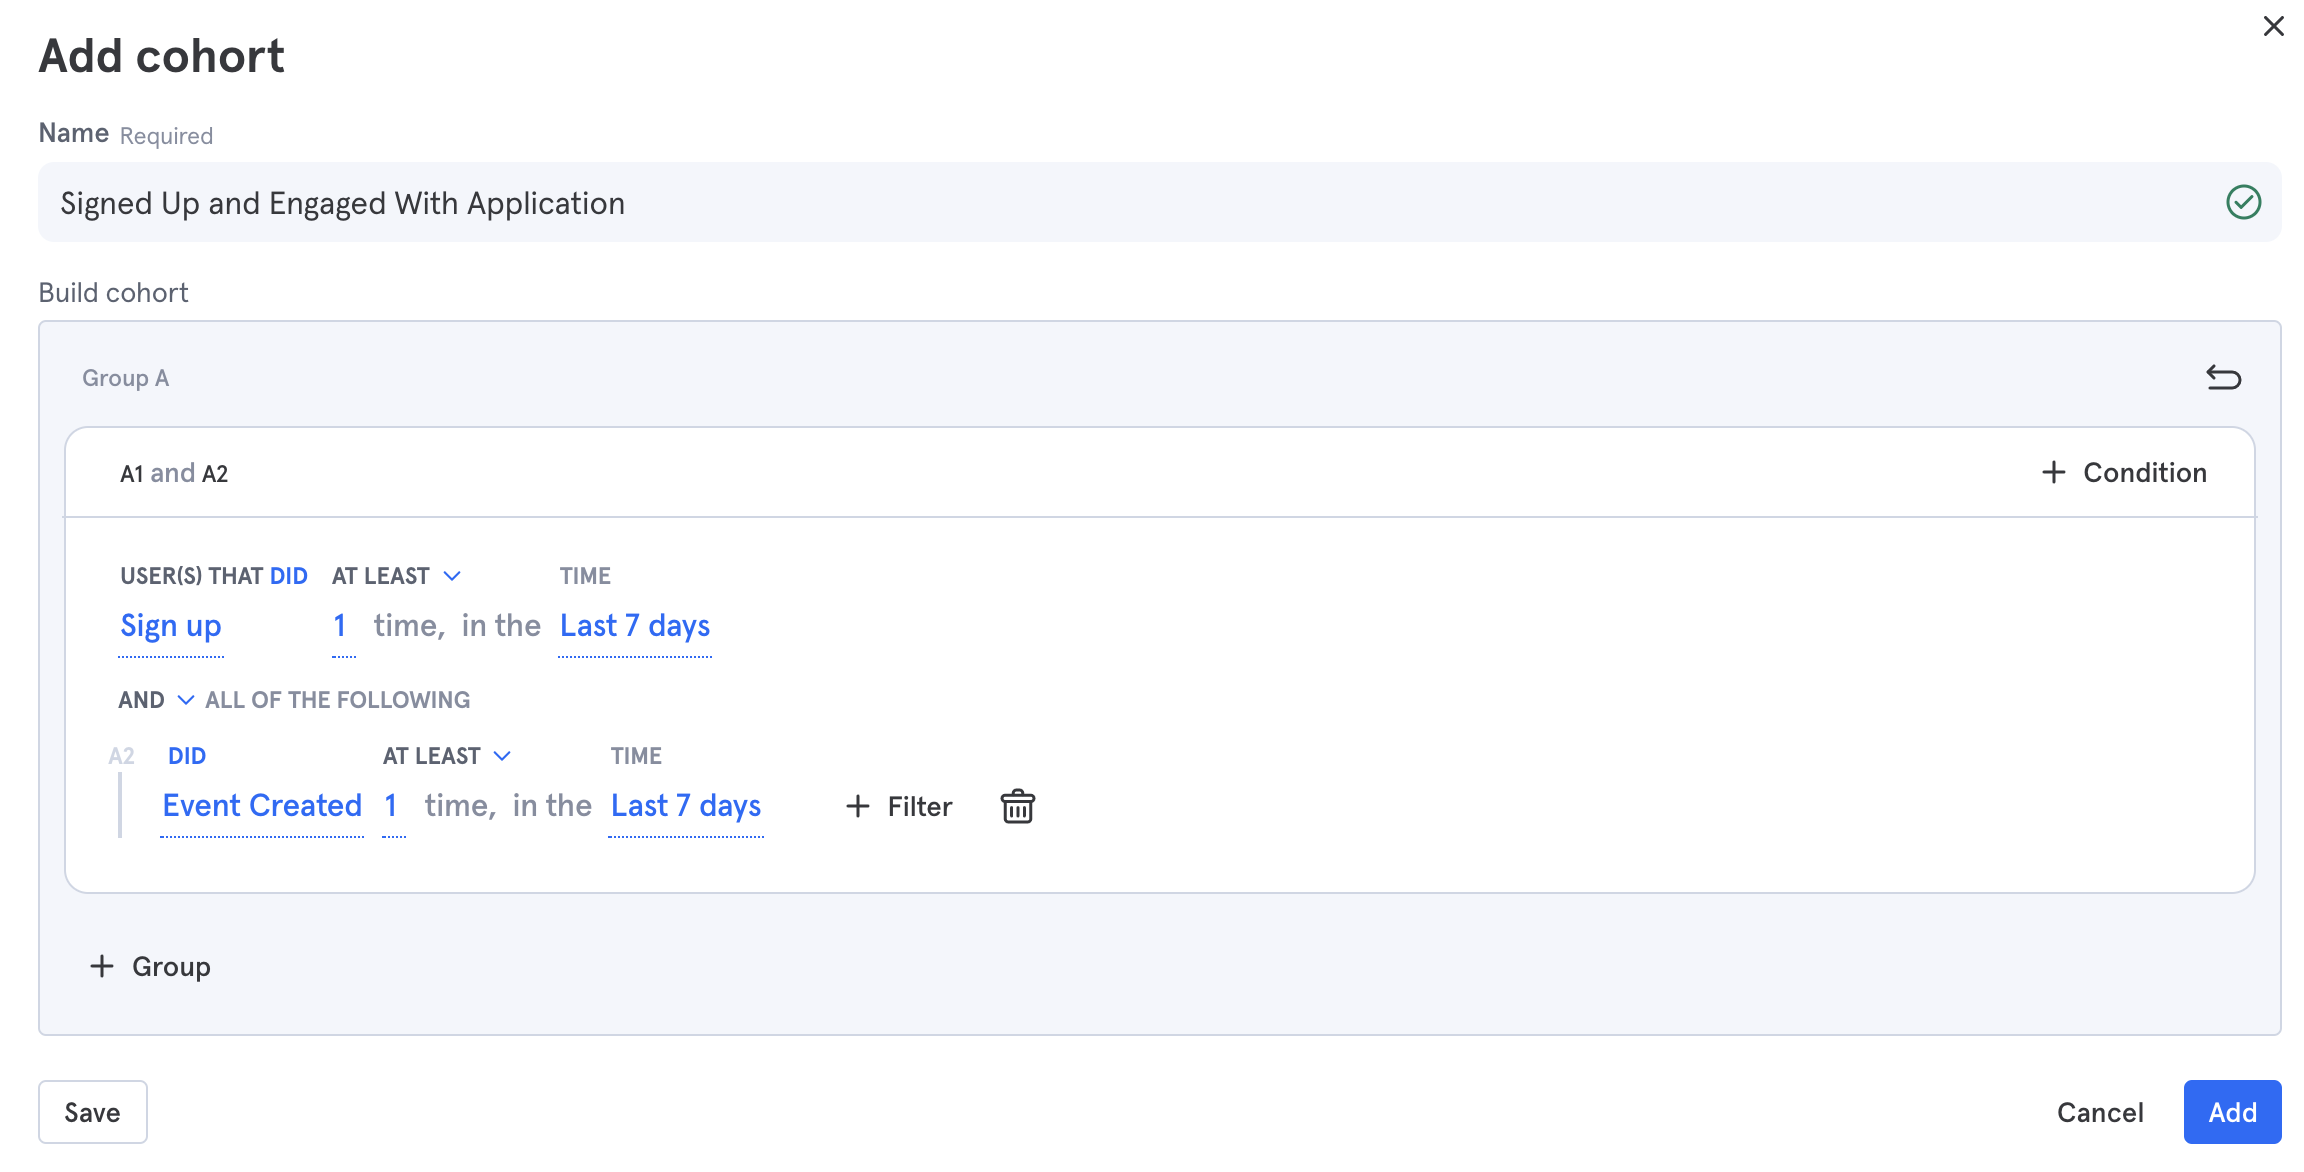
Note: Be sure to change the time periods if you're looking at monthly instead of weekly retention.
Now we have graphed our Active Users ("Event Created - WAU") and our Active Sign-Ups ("Signed up and engaged").
Calculate Retention#
Our final step is to apply the retention formula.
A = Active Users (users who did a Core User Action)
B = Active Sign-Ups (users who signed up and did a Core User Action)
Retention for the time period = (A - B)
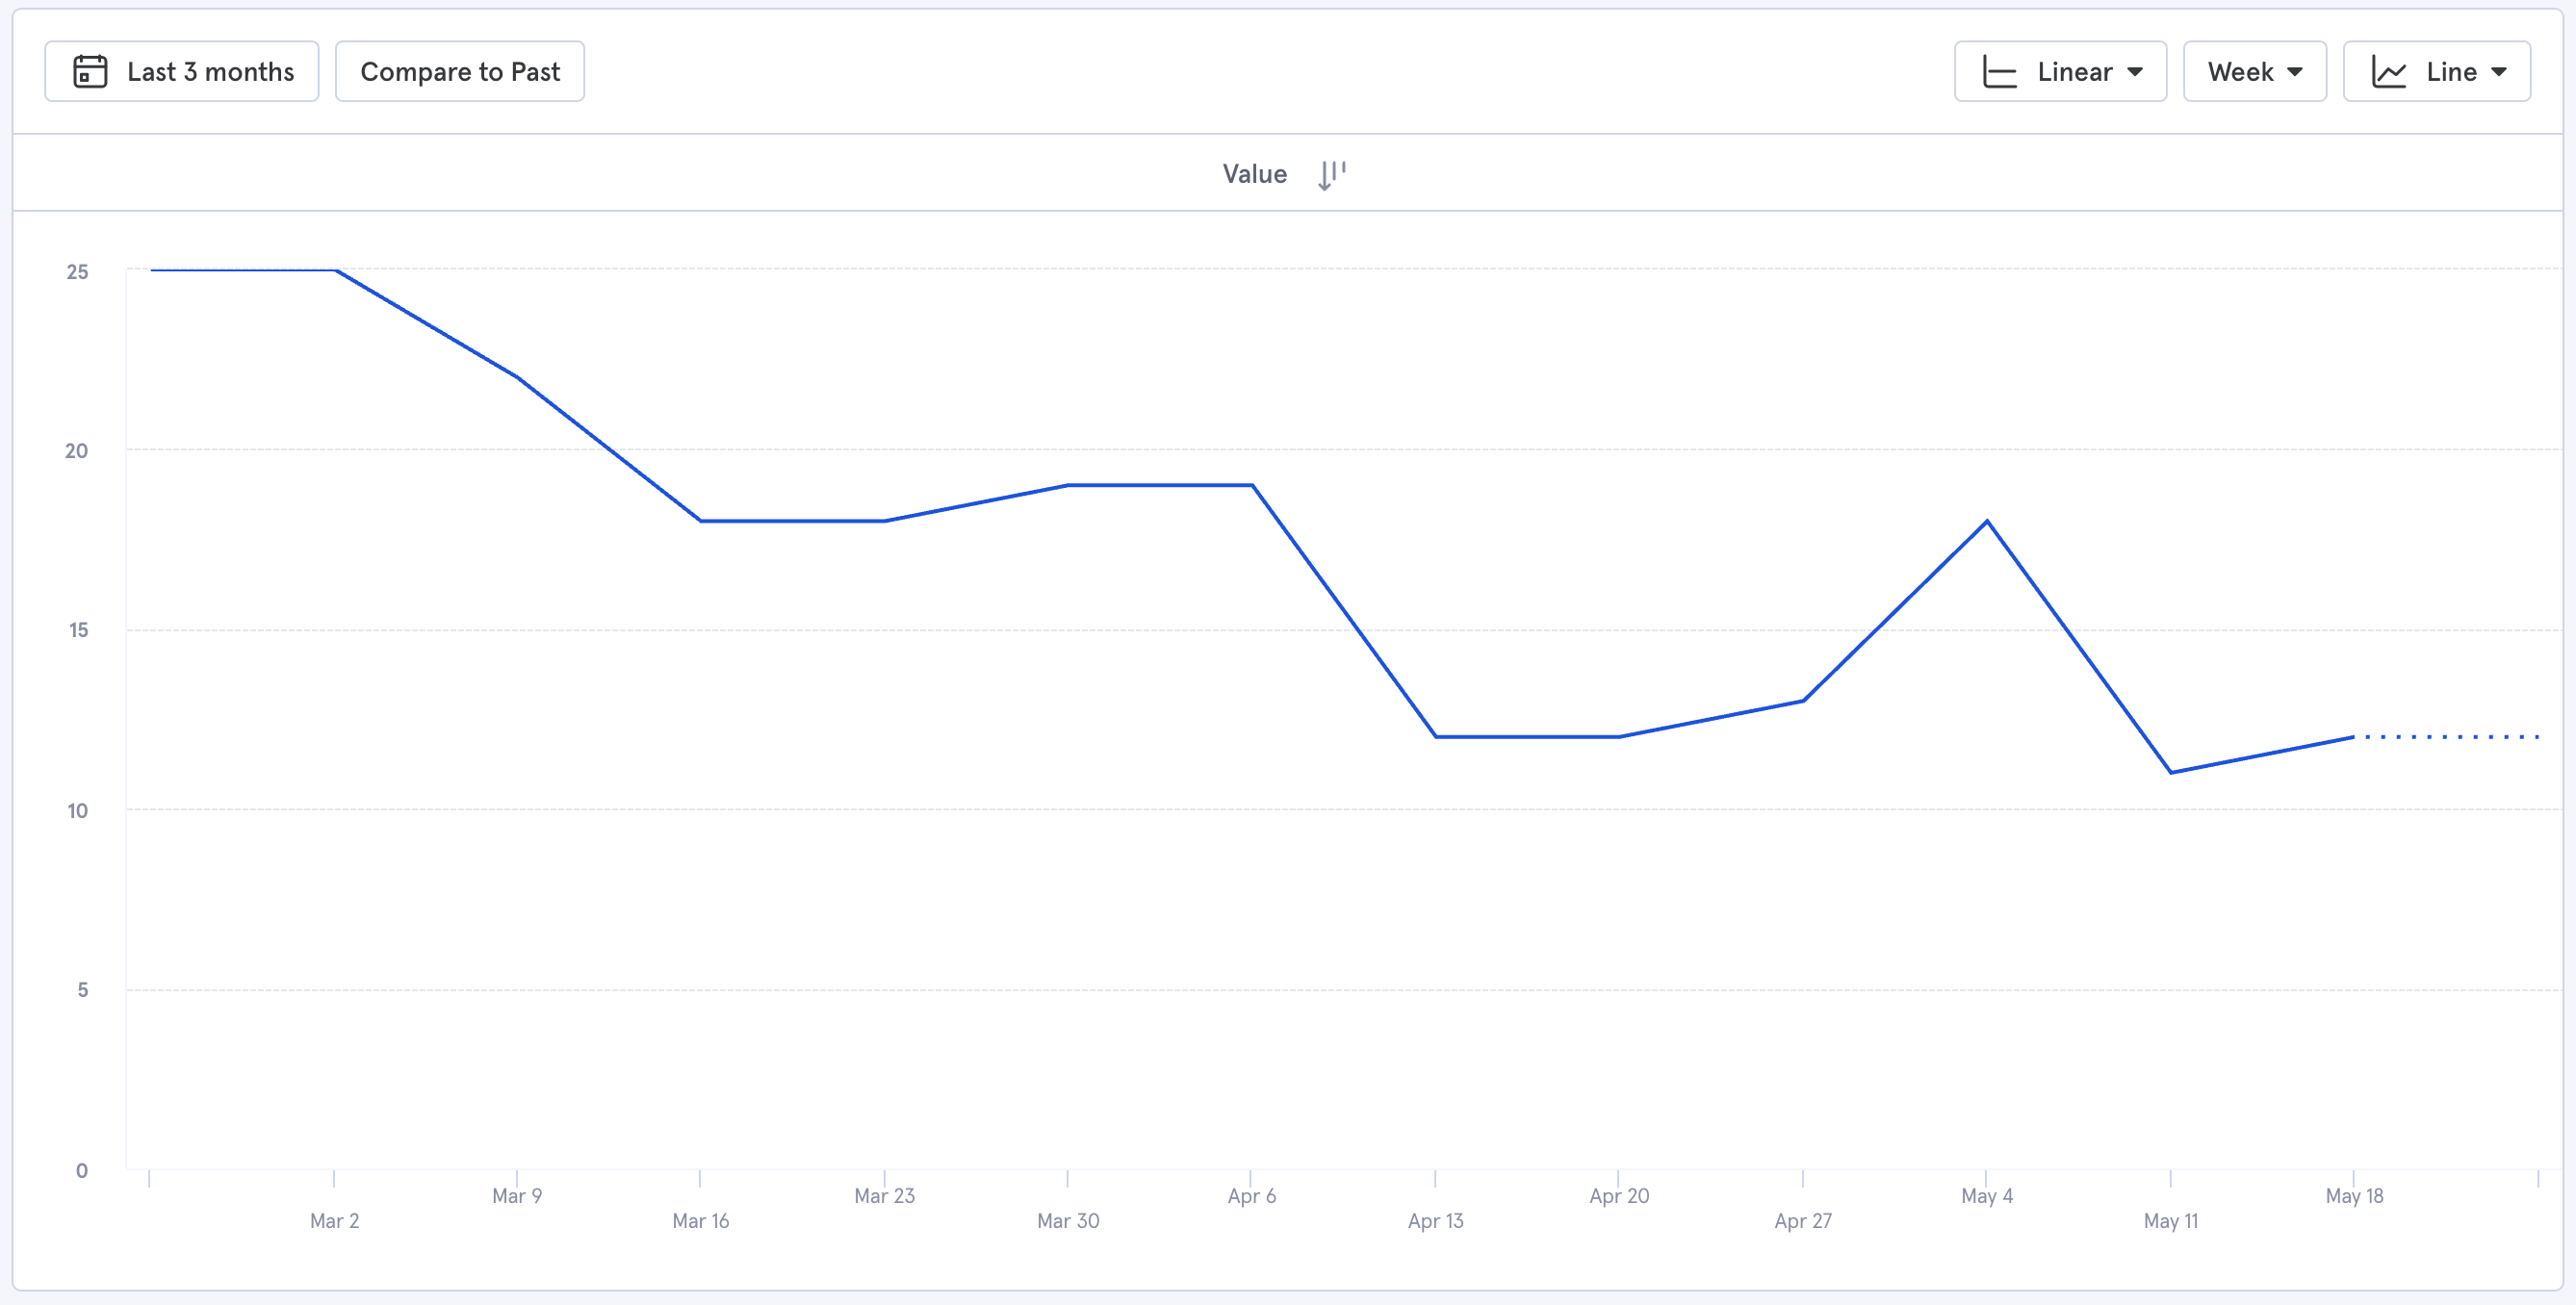
In Mixpanel, click "+ Formula", input "A - B", and save.

We can now view our retention. 🎉
Synthesis#
Take a look at the retention graph. The number of retained users is slowly decreasing. That's because this example data has a negative retention rate on average. A positive retention rate would show a line sloping up and to the right.
Hovering over the graph we can see the retention rate for Mar 16 - Mar 22 is -18.18% compared to the previous week.
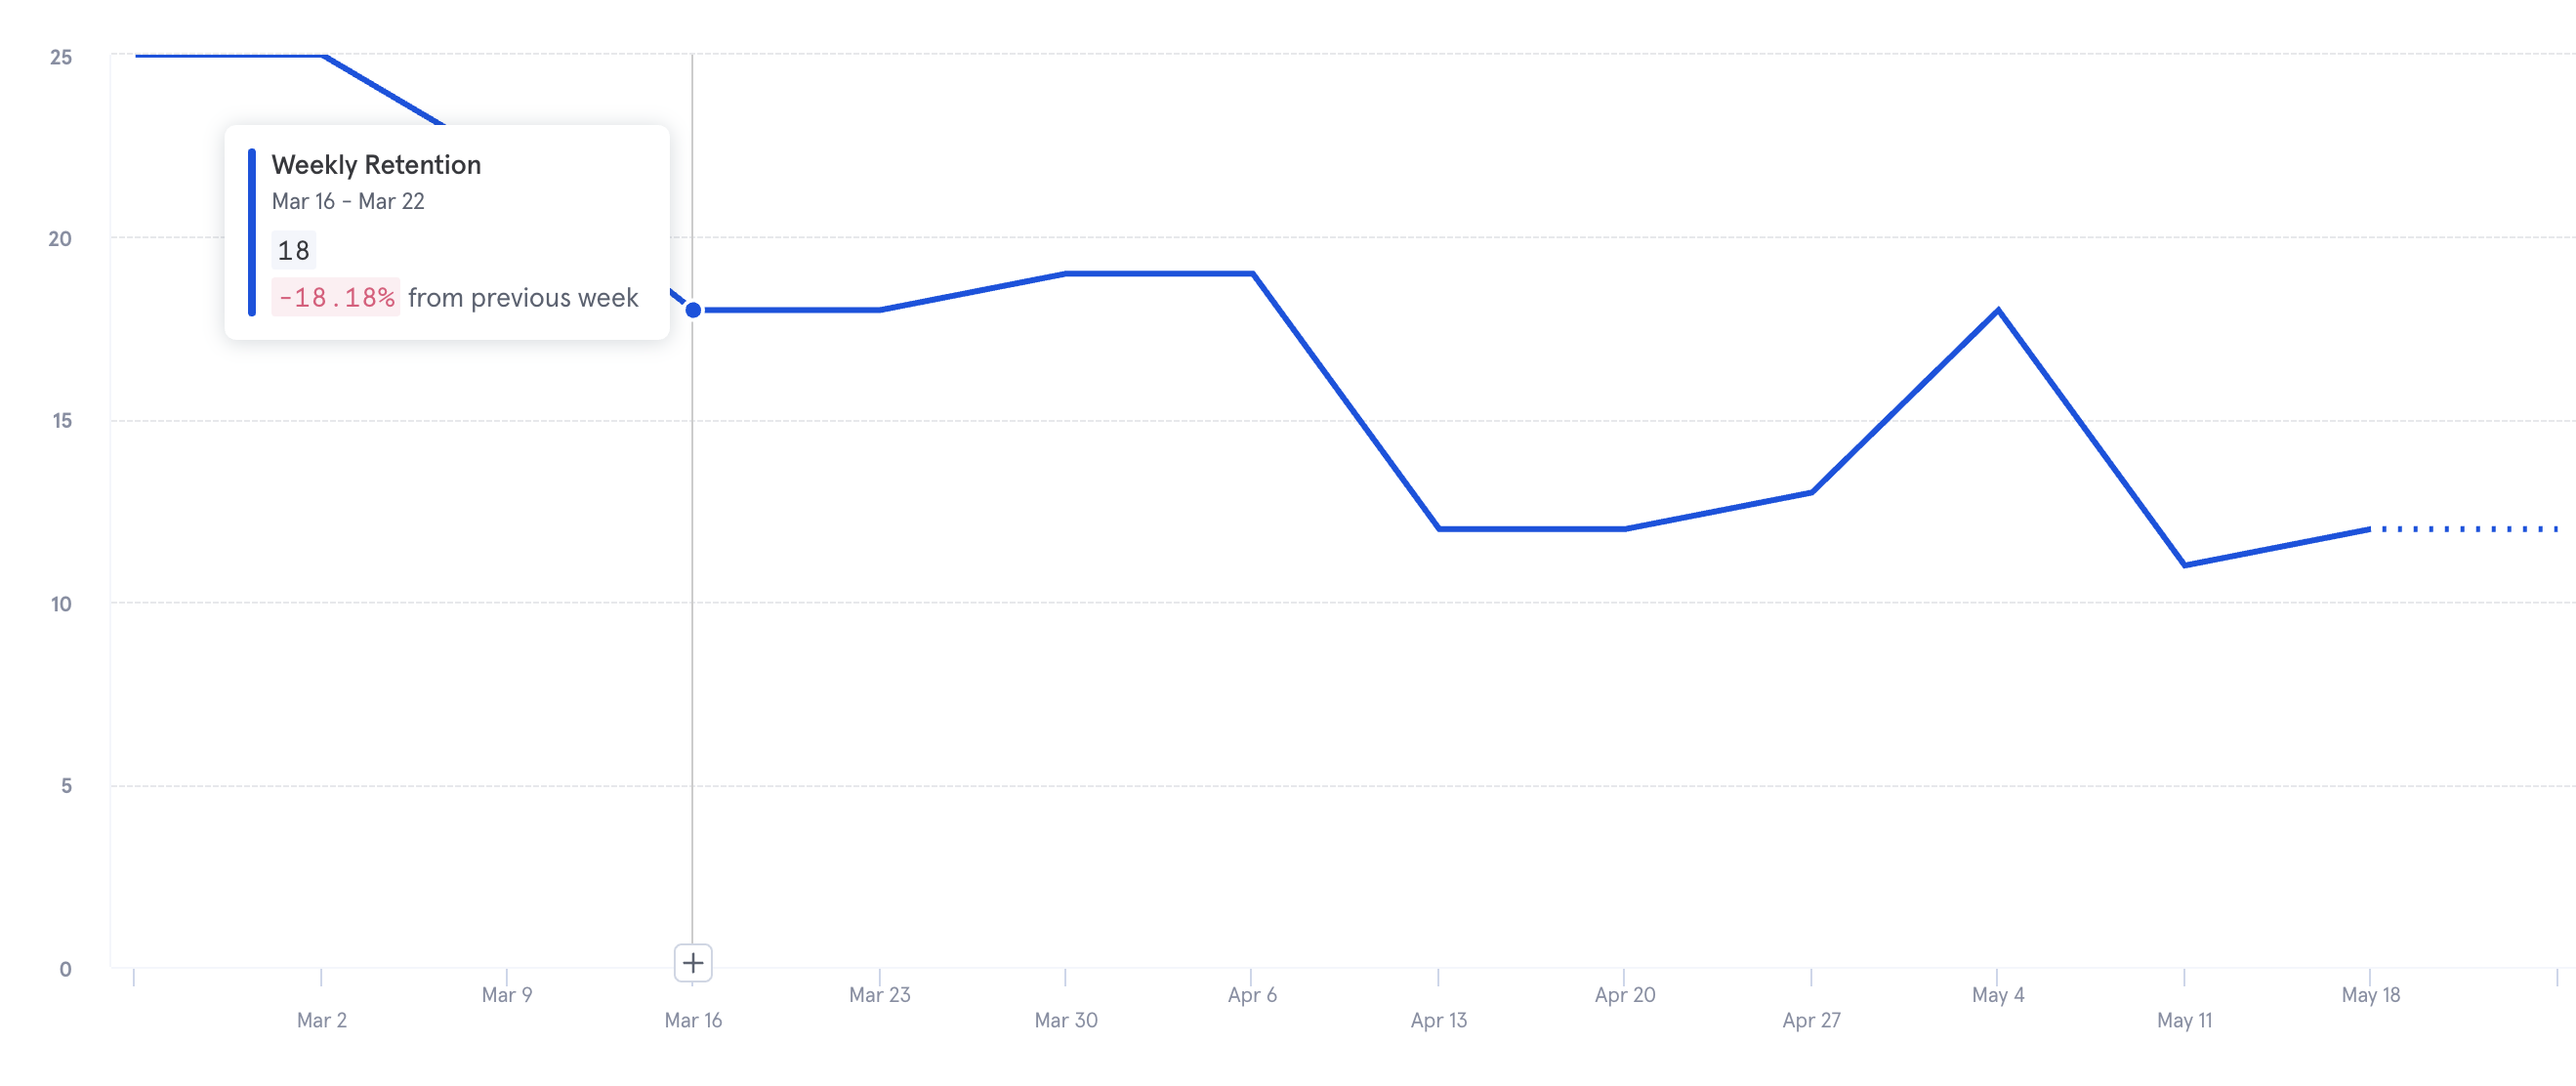
It's not always negative. The week of May 4 - May 10 saw an increase in retained users. On average, however, the retention rate is negative.
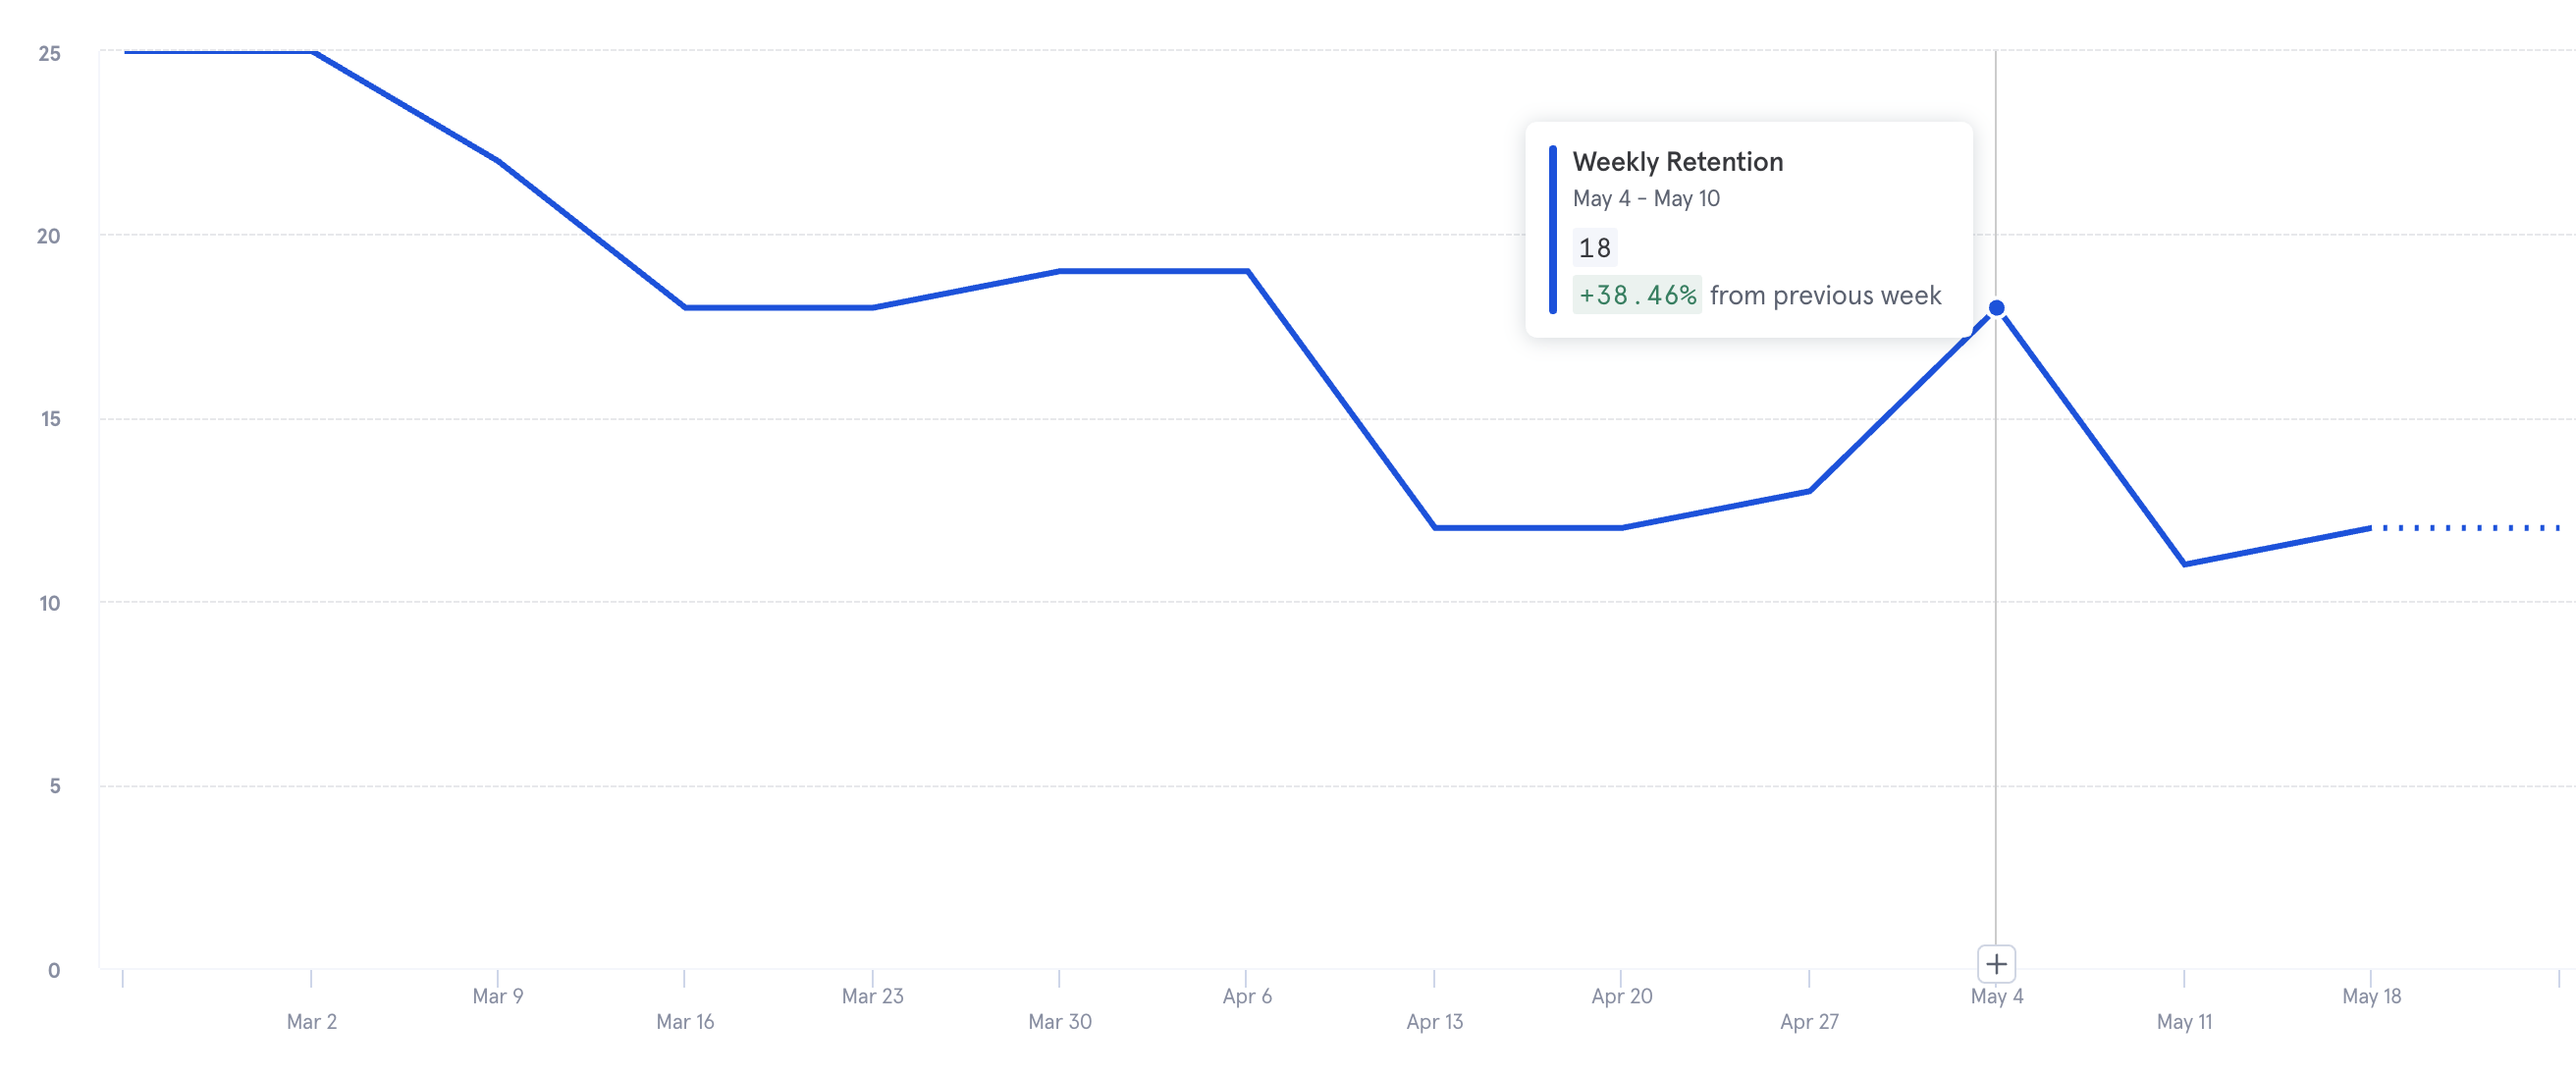
Let's zoom out to get the bigger picture.
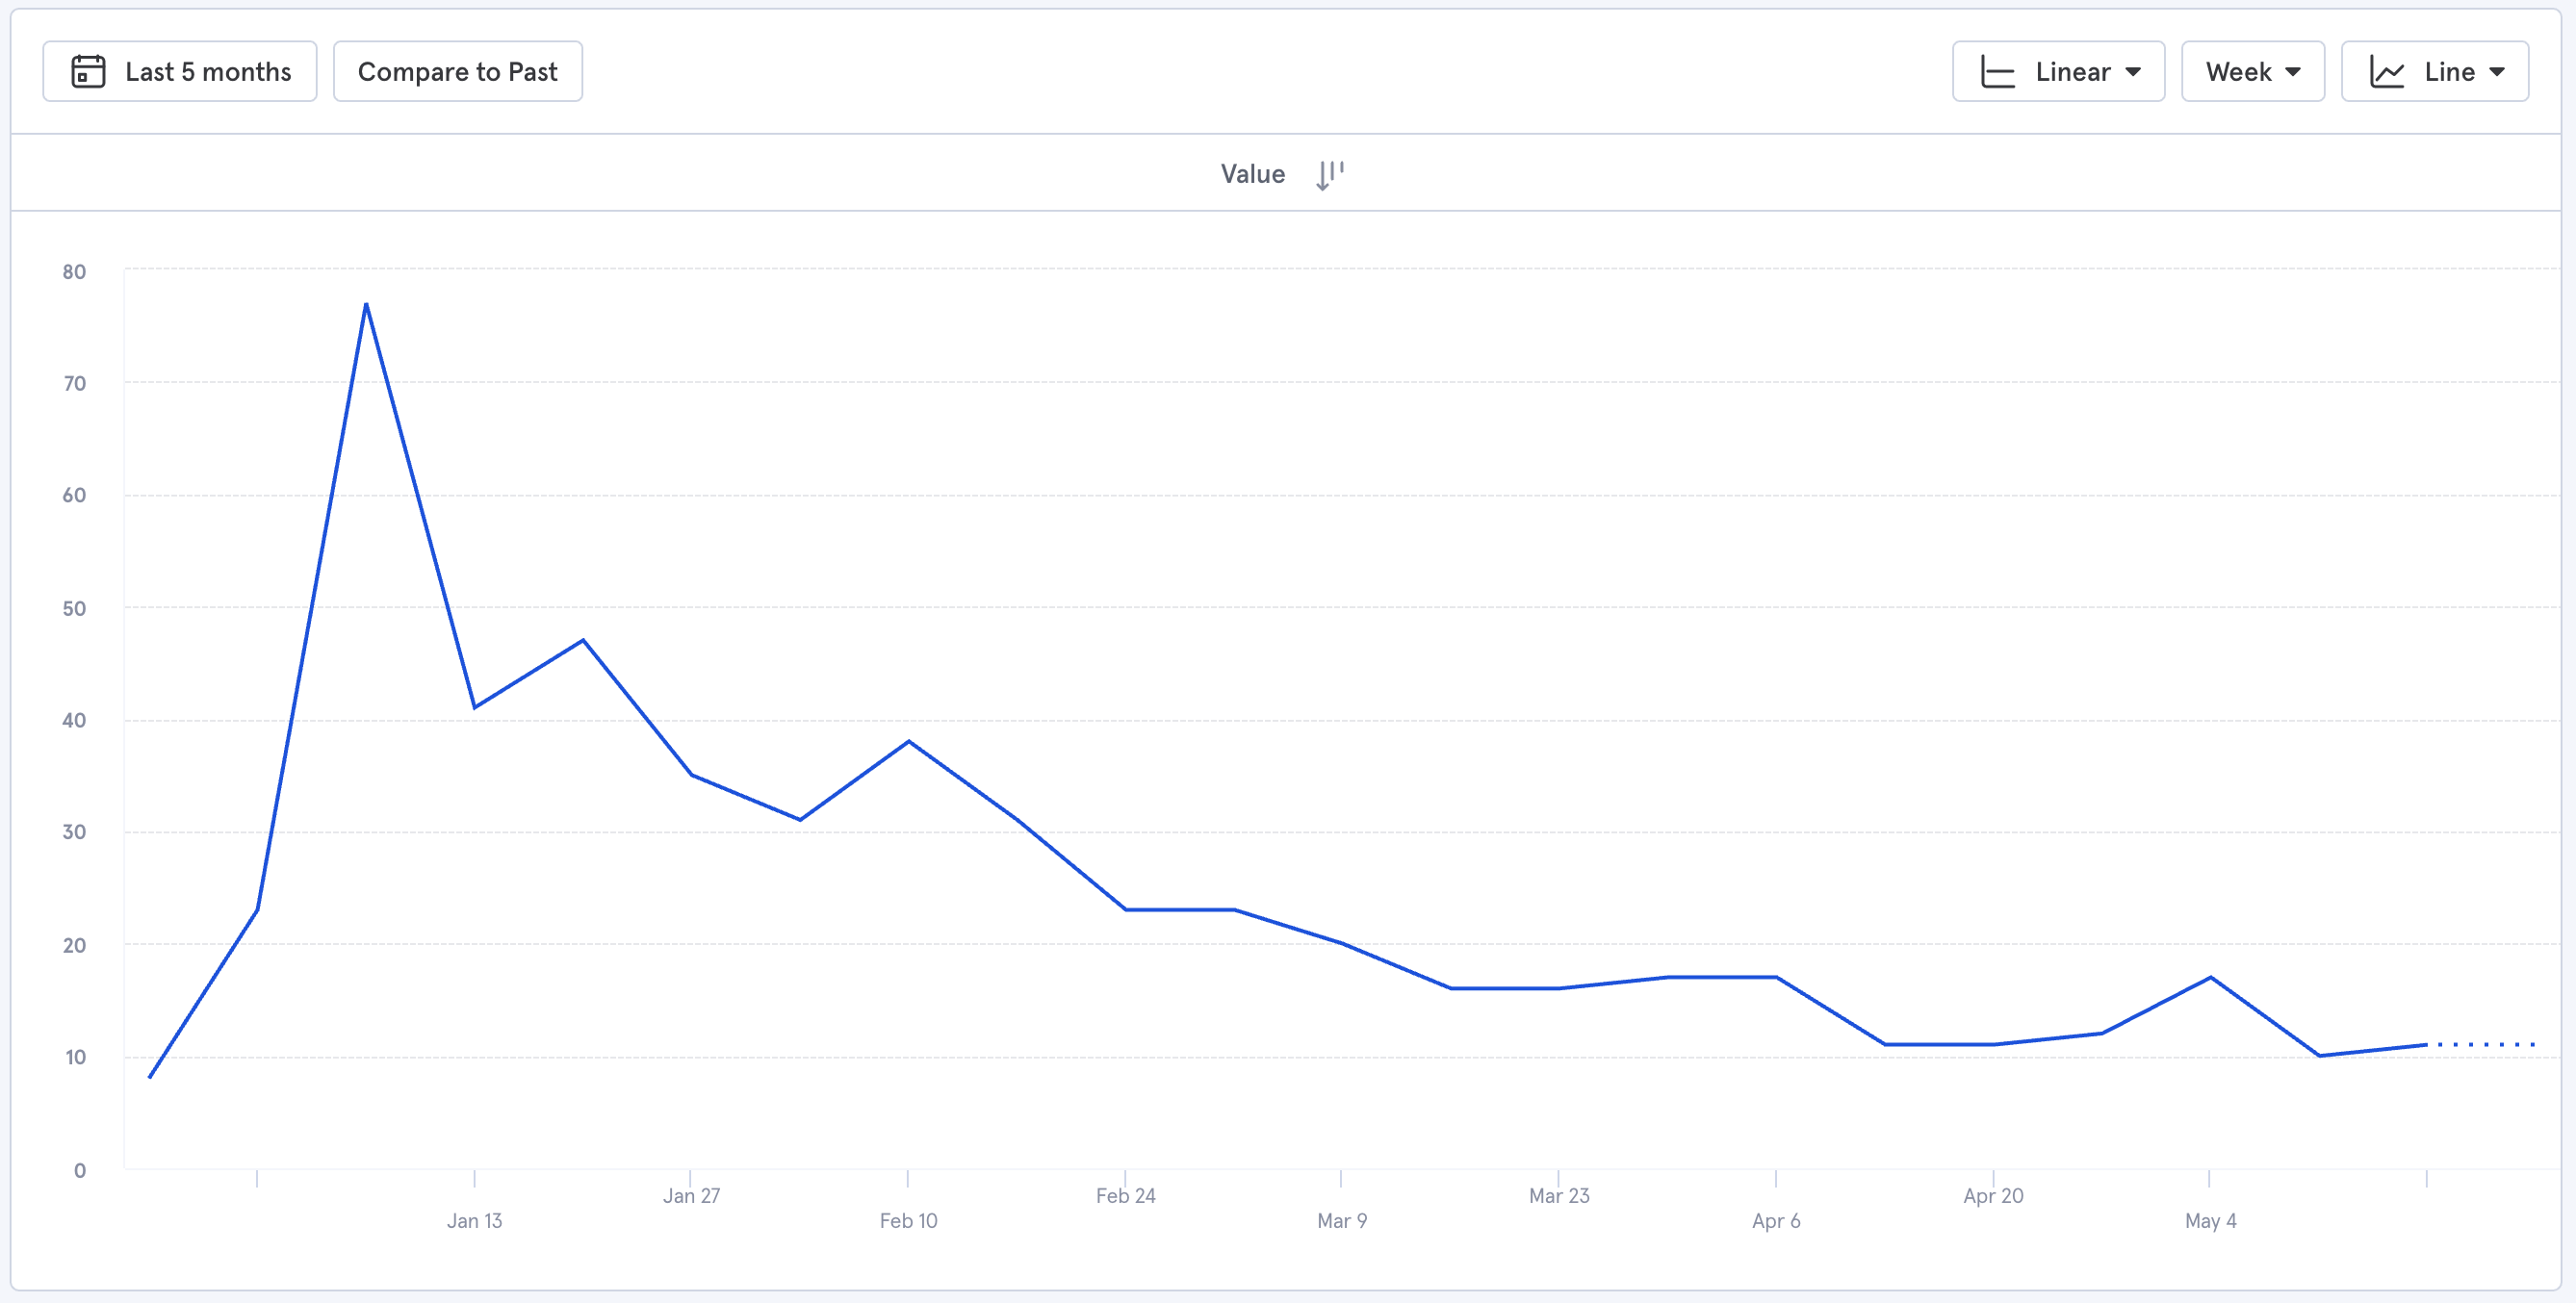
You can see a spike of new active users. That was a marketing event. Since then, the number of retained users has been falling. Signing up more and more users does not usually fix this problem because the retained users will slowly decrease when sign-ups eventually dry up.
To turn this downward slope into an upward slop you must work to make the application more valuable to users so they are more likely to stay.
Sum It Up#
This is a straight-forward approach of measuring retention that you can set up quickly. It gives you an understanding of how many people really use your application. It also shows you how your retention rate effect your active users. Now go forth and make something valuable for your users!
About The Author#
Hi I'm Jim. I've been working with Mixpanel since 2016 and have worked with product analytics since 2014. I set up analytics for projects in several organizations including Groupon, Dynamo Metrics, Brooklet, and Trove (now defunct). I am a software engineer and engineering manager interested in software products.